Crafting a metrics framework to guide product success
OverviewI moved Intruder from relying on ad hoc revenue tracking to a scalable, behaviour-based measurement system.
I successfully lobbied for us to create a unified way to evaluate company strategy, make product decisions, and empower designers and product managers to lead with evidence.
The effort was so successful it was held up by Intruder’s BI tool as a case study in how to align a company around a shared set of metrics.
GoalsProduce a way of measuring product growth based on user behaviour.
Provide a means to identify behavioural bottlenecks constraining company growth
Align product teams around a set of measurements for a consistent and shared standard of success.
RoleWhenProject ManagerCollaboratorsVP of Product, Head of Customer Support, Data teamQ3 2024Context and Team
Intruder measured success through ad hoc financial indicators with no consistent framework for evaluating product changes.
Feature releases were assessed individually by Senior Leadership through lengthy debates, making it nearly impossible to tie revenue impact to specific user behaviours. It also tied personal reputation to each release endorsed, and this made it hard to assess a release on it’s actual results.
Together with the Head of Customer Success we approached the VP of Product with a proposal I drew together which went on to be adopted company wide and the shared means of measuring success for all product teams.
The Problem
Prior to the project a lot of product decisions were made based on measurements which varied over time. This made it hard to demonstrate genuine progress over time as there wasn’t a persistent consensus on the metrics that mattered for the product. Definitions could be debated, alternatives proposed, and practically the landscape was always shifting.
Seeing this myself and the Head of Support were keen to advocate for a persistent set of behavioural metrics that were a leading indicator of revenue. Metrics which tied directly into the value Intruder represented to its customers and we could refer to on a sustained basis.
Discussing this we identified a four of core things we wanted to propose and raised with the VP of Product:
Depict Customer Value: The metrics we wanted to identify had to stand in place for the value felt by customers and made them want to pay for the product.
Encouraged Learning: The metrics needed to encourage us to discover new and innovative ways to increase the value of the product over merely optimising existing functionality.
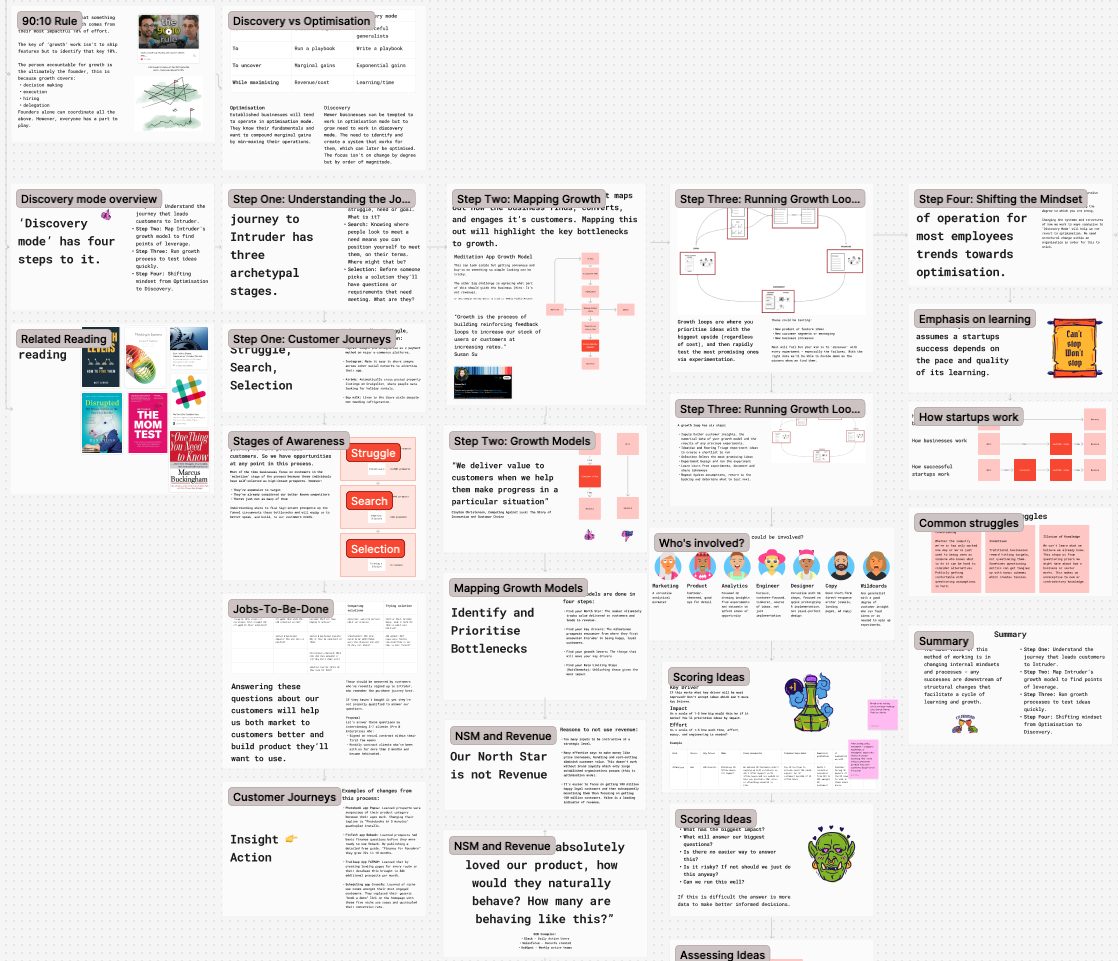
Screens I put together when approaching the topic with the VP of Product
Visualised Bottlenecks: We needed to be able to visualise where the limiting factor to growth was in the business at any point in time and observe how it moved as changes were made.
Directed Attention: Anyone in the organisation, by looking at the metrics, should be able to know what sort of thing they were doing, or could do, to drive growth.
Research and Insight
We got buy-in from the VP of Product to explore this and we then began the process of trying to map what growth for the product looked like. This followed the process taught by Matt Lerner to go about identifying the North Star and Key Driver metrics of a product.
I used survey data, user interviews and our BI tool Count to come up with an initial draft of the Map. New and existing customers felt the value of Intruder at similar points in their experience of the tool:
“In testing the tool, we identified an existing threat in one of our systems that we were unaware of. We were able to remediate the vulnerability before it could be exploited.”
Interview subject
New Customers: Felt the value of Intruder most prominently the first time they found and fixed a serious security issue that they were not aware of.
Free Trials where at least one issue was found converted at 10.27%, compared to just 2.88% where no issues were found, a 257% difference.
The effect compounded with volume: trials finding 5 or more issues converted at 14.4%, roughly double the 7.12% rate for those finding only 1–4.
There were a lot of formal reasons people used Intruder, but none had the emotional and psychological impact of the above. This was represented by the fact that diverse and varied customers kept on saying the value Intruder held for them was “Peace of Mind”.
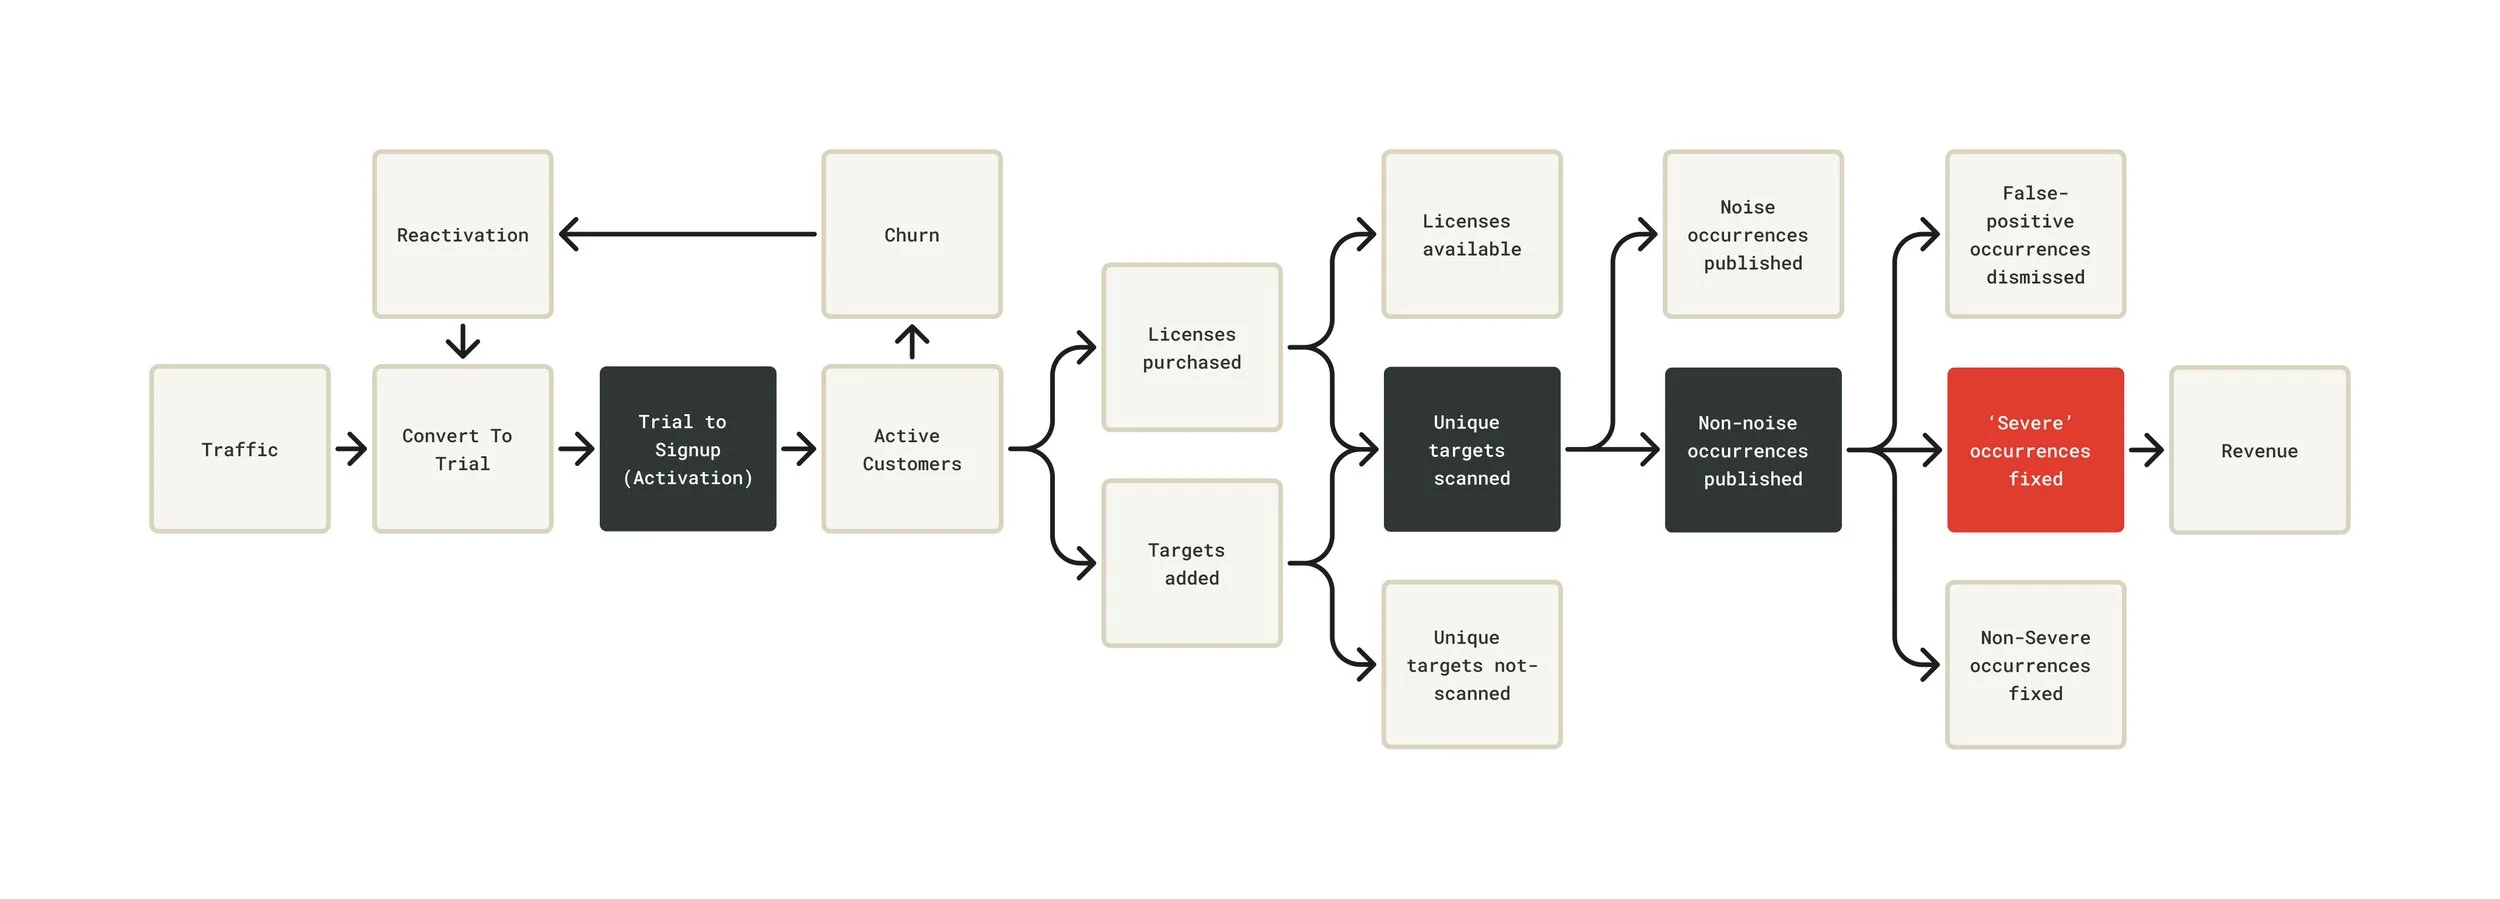
We then tried to diagrammed out how the path to this would look as a flow:
“It gives us and our customers peace of mind. The monthly scan, along with immediate vulnerability updates keeps us all in the loop, and there's nothing more satisfying than receiving an 'Emerging Threats' email which calmly tells you that you've passed.”
Interview subject
Existing Customers: Continued to feel the value of Intruder most prominently when it continued to discover newly published previously undiscovered vulnerabilities quickly.
Strategic Reframe
After determining that Intruder’s ‘North Star’ was a severe occurrence/vulnerability that had been fixed we had to identify how we were actually going to drive this forwards. We needed to identify, using our research, 3-4 drivers of the north star.
These would need to align with Intruder’s revenue model that was powered by selling licenses to scan a unique target each month.
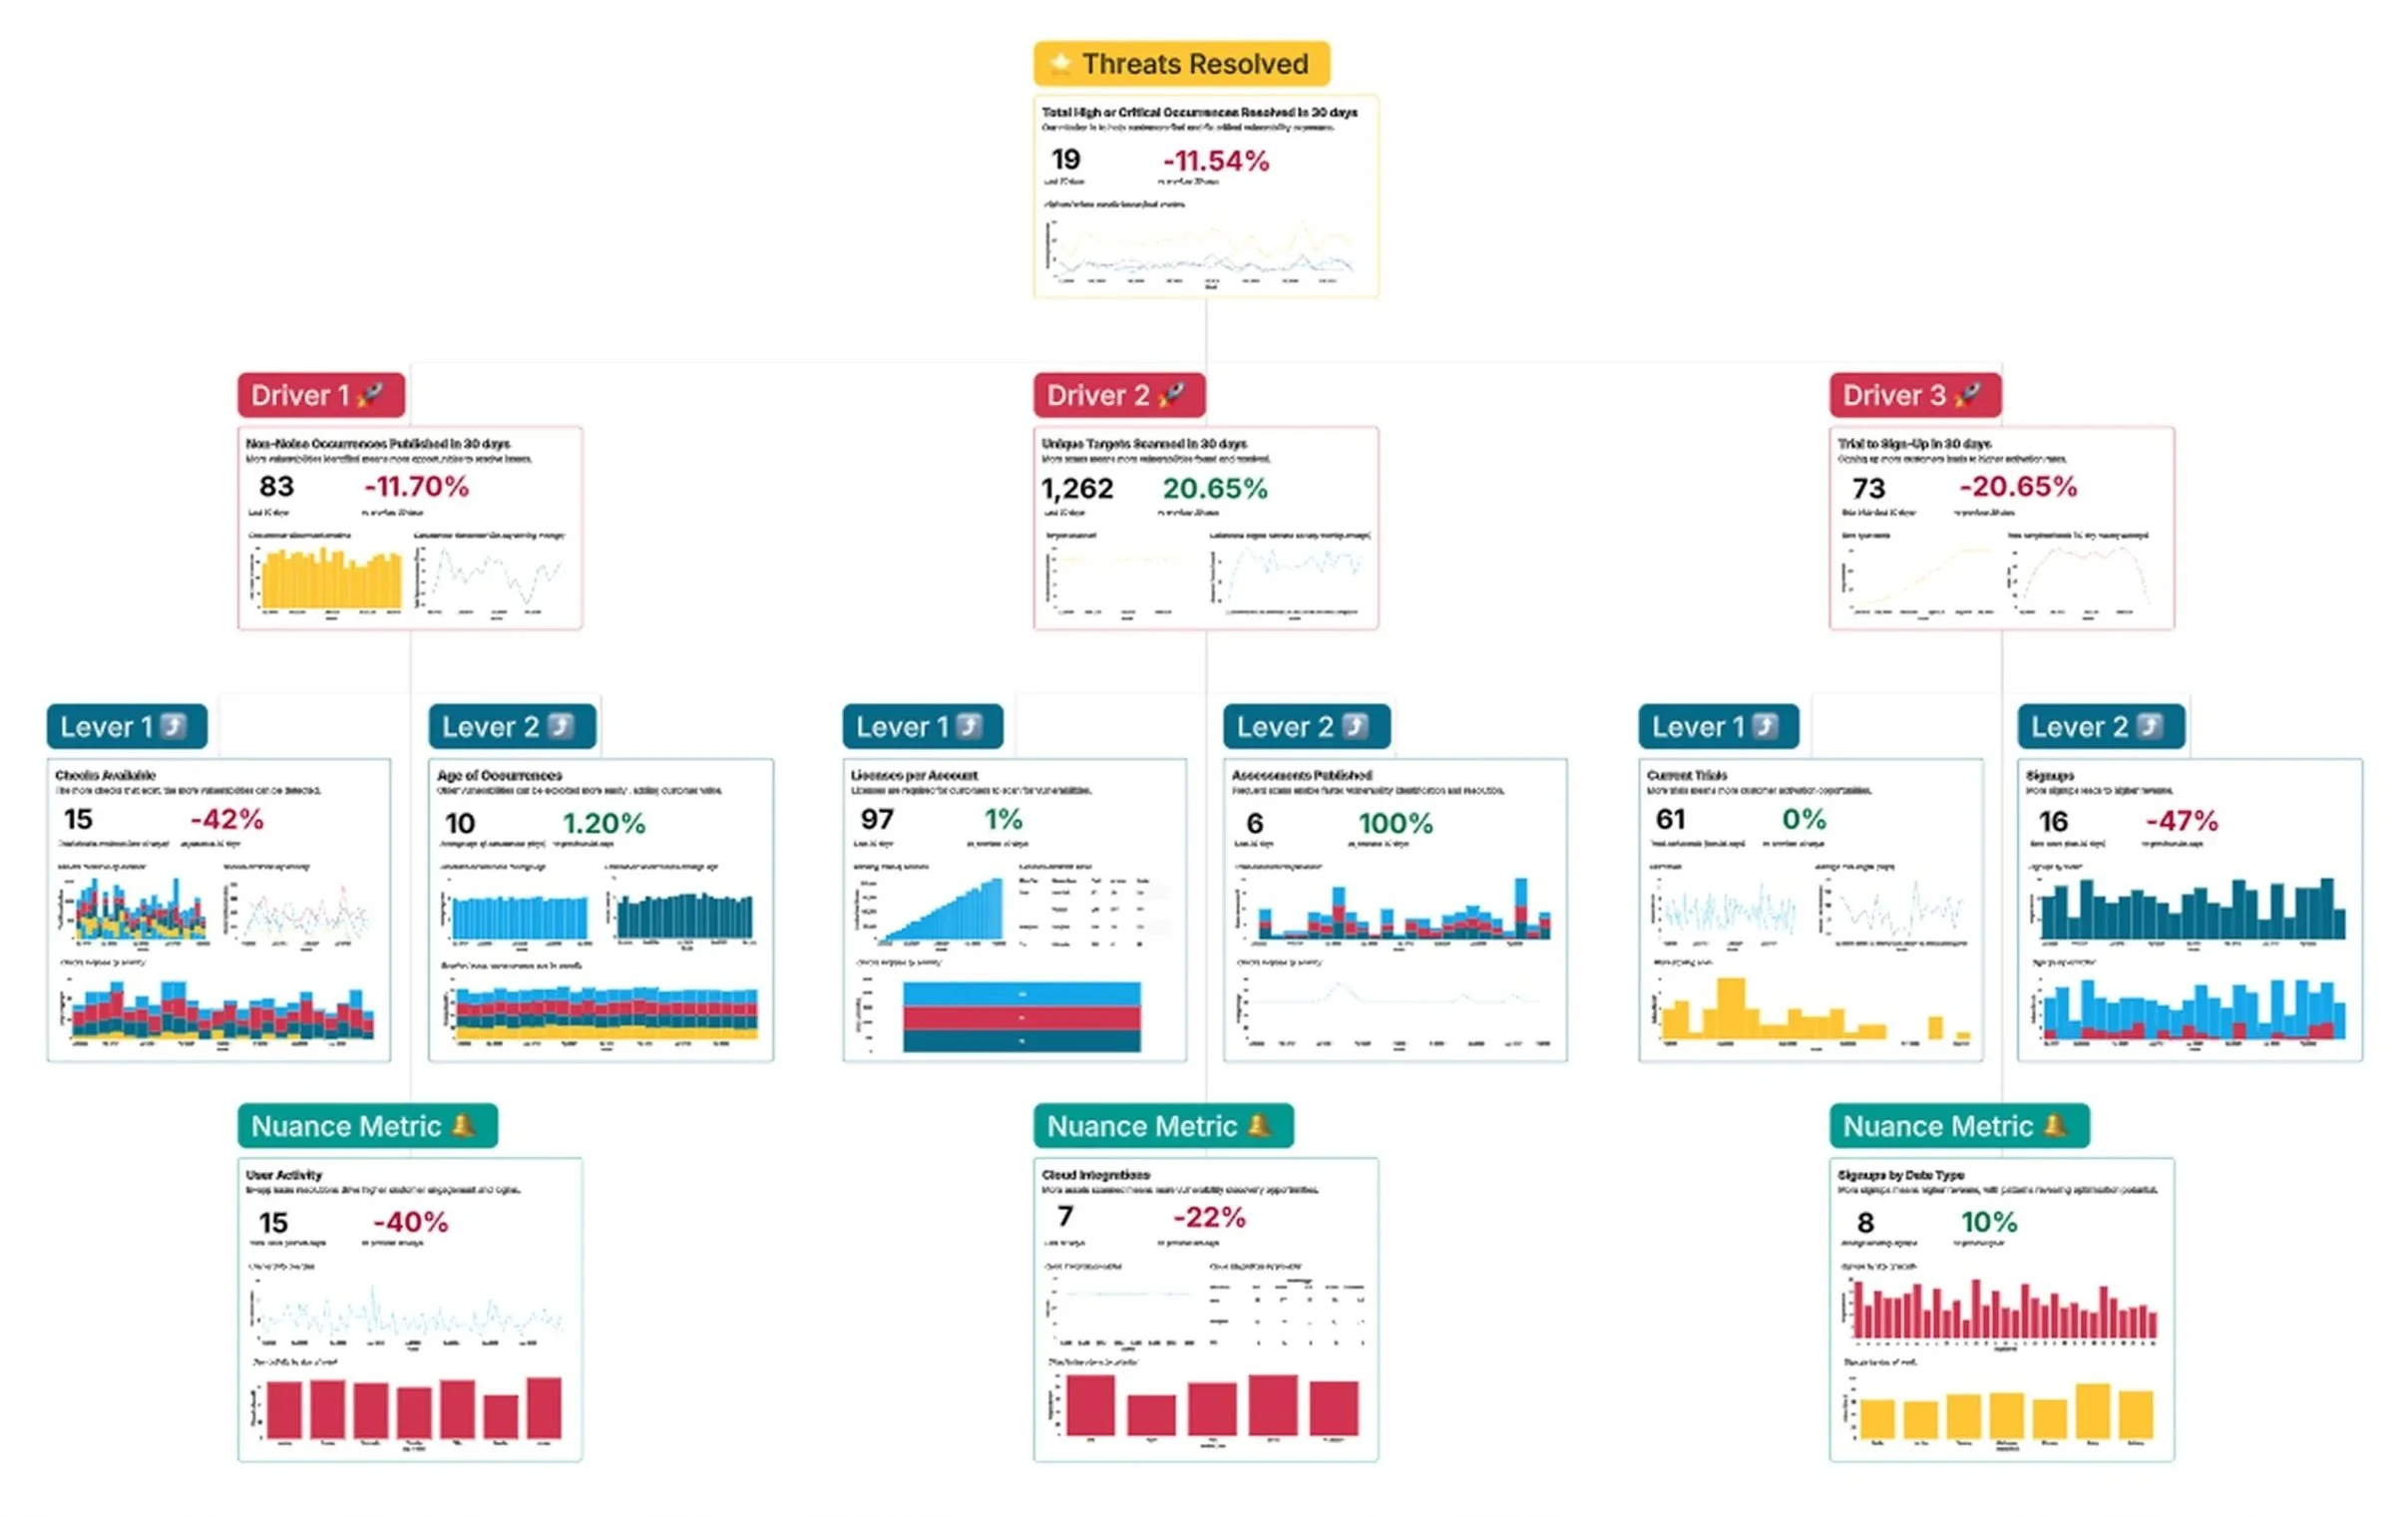
Each of those Key Drivers would then have to be moved by pulling on a range of levers we identified. They had shorthand labels applied (shown below) but each one had a specific metric attached to it:
Trial to Signup (Activation)
Inbounds
Number of signups from direct or non-branded search
Outbounds
Number of outbound signups (by channel and CPA)
Marketing Site Conversion
Number of new Trials generated
Trial Conversion
Number of Trials converting to Customers/Sign ups
Unique targets scanned
Habituation
# of customers with a lifespan greater than 6 months (by tier)
Targets
Number of targets (by source)
Licenses
Number of used licenses (by type)
Scans
Number of scans run (by type)
We identified these as significant data points in collaboration with the data team and then shared these with the broader leadership team. We proposed that every product decision we made should be traceable to a question: does this increase the likelihood and volume of issues being found and fixed with Intruder? That would become the lens for prioritisation, for evaluating new features, and for thinking about the trial experience.
It also changed what "activation" meant. Rather than defining activation as "user runs their first scan," we began working toward a definition anchored in value delivery, a customer reaching the point where Intruder had found something real for them.
Whilst customers varied in their behaviour, based on account age or business maturity, this captured the core value that was consistent across the board.
Non-noise occurrences published
Severe occurrences
# of True Positive Critical or High severity issues detected
Checks available
Intruder Checks Available for Primary Issues
Age of occurrences
Time to fix for Primary Issues
True occurrences
Improved rate of true positive occurrences
Solution Execution
Visualising the metrics
We then implemented this view into Count, Intruder’s BI tool. When Count subsequently found out about this they were keen to feature it in one of their Webinars entitled 'Making OKRs Work’ to share with their current and prospective customers.
Below is a example of Intruder’s growth metrics dashboard put together by Count, giving an impression of how the actual dashboard ended up looking.
“The thing that sparked us moving away from those other tooling and going more towards this data-driven approach to OKRs … was Naomi, whose our Head of Support, and Keith, our Head of Design. They came to the senior leadership team and said this isn’t working … and because of them we had that discussion.”
Andy Hornegold, VP Product at Intruder
Count webinar: Making OKRs Work: 13:12
“I sat down with Keith, our Head of Product Design, and we tried to work out the key drivers … This really for me is about understanding at a top level whether all of the levers and components are moving in the right direction.”
Andy Hornegold, VP Product
Count webinar: Making OKRs Work: 28:31
Using the metrics to drive change
Once we had this in place we were able to clearly define bottlenecks in the growing of the customer base.
We were also able argue for the introduction of teams that could be assigned key drivers as specific areas of focus. This allowed leadership to delegate discussions on specific changes being proposed to product squads, introduced as a result of this initiative who were ultimately held accountable for outcomes rather than their output.
This also led to the introduction of key changes we’d not had a framework for previously.
Non-noise occurrences published
Of Intruder’s Key Drivers it had traditionally done the least to address what we were calling ‘Non-noise occurrences published’ but with the rollout of the new growth model we realised we need to do more to prioritise this aspect of the customer’s experience.
We had backend teams looking at what we could do to pull on the Growth Levers ‘Checks available’ and ‘True occurrences published’ but from a customer facing perspective we wanted to focus on what we could do with to reduce ‘Age of occurrences’.
Cutting down time to Triage
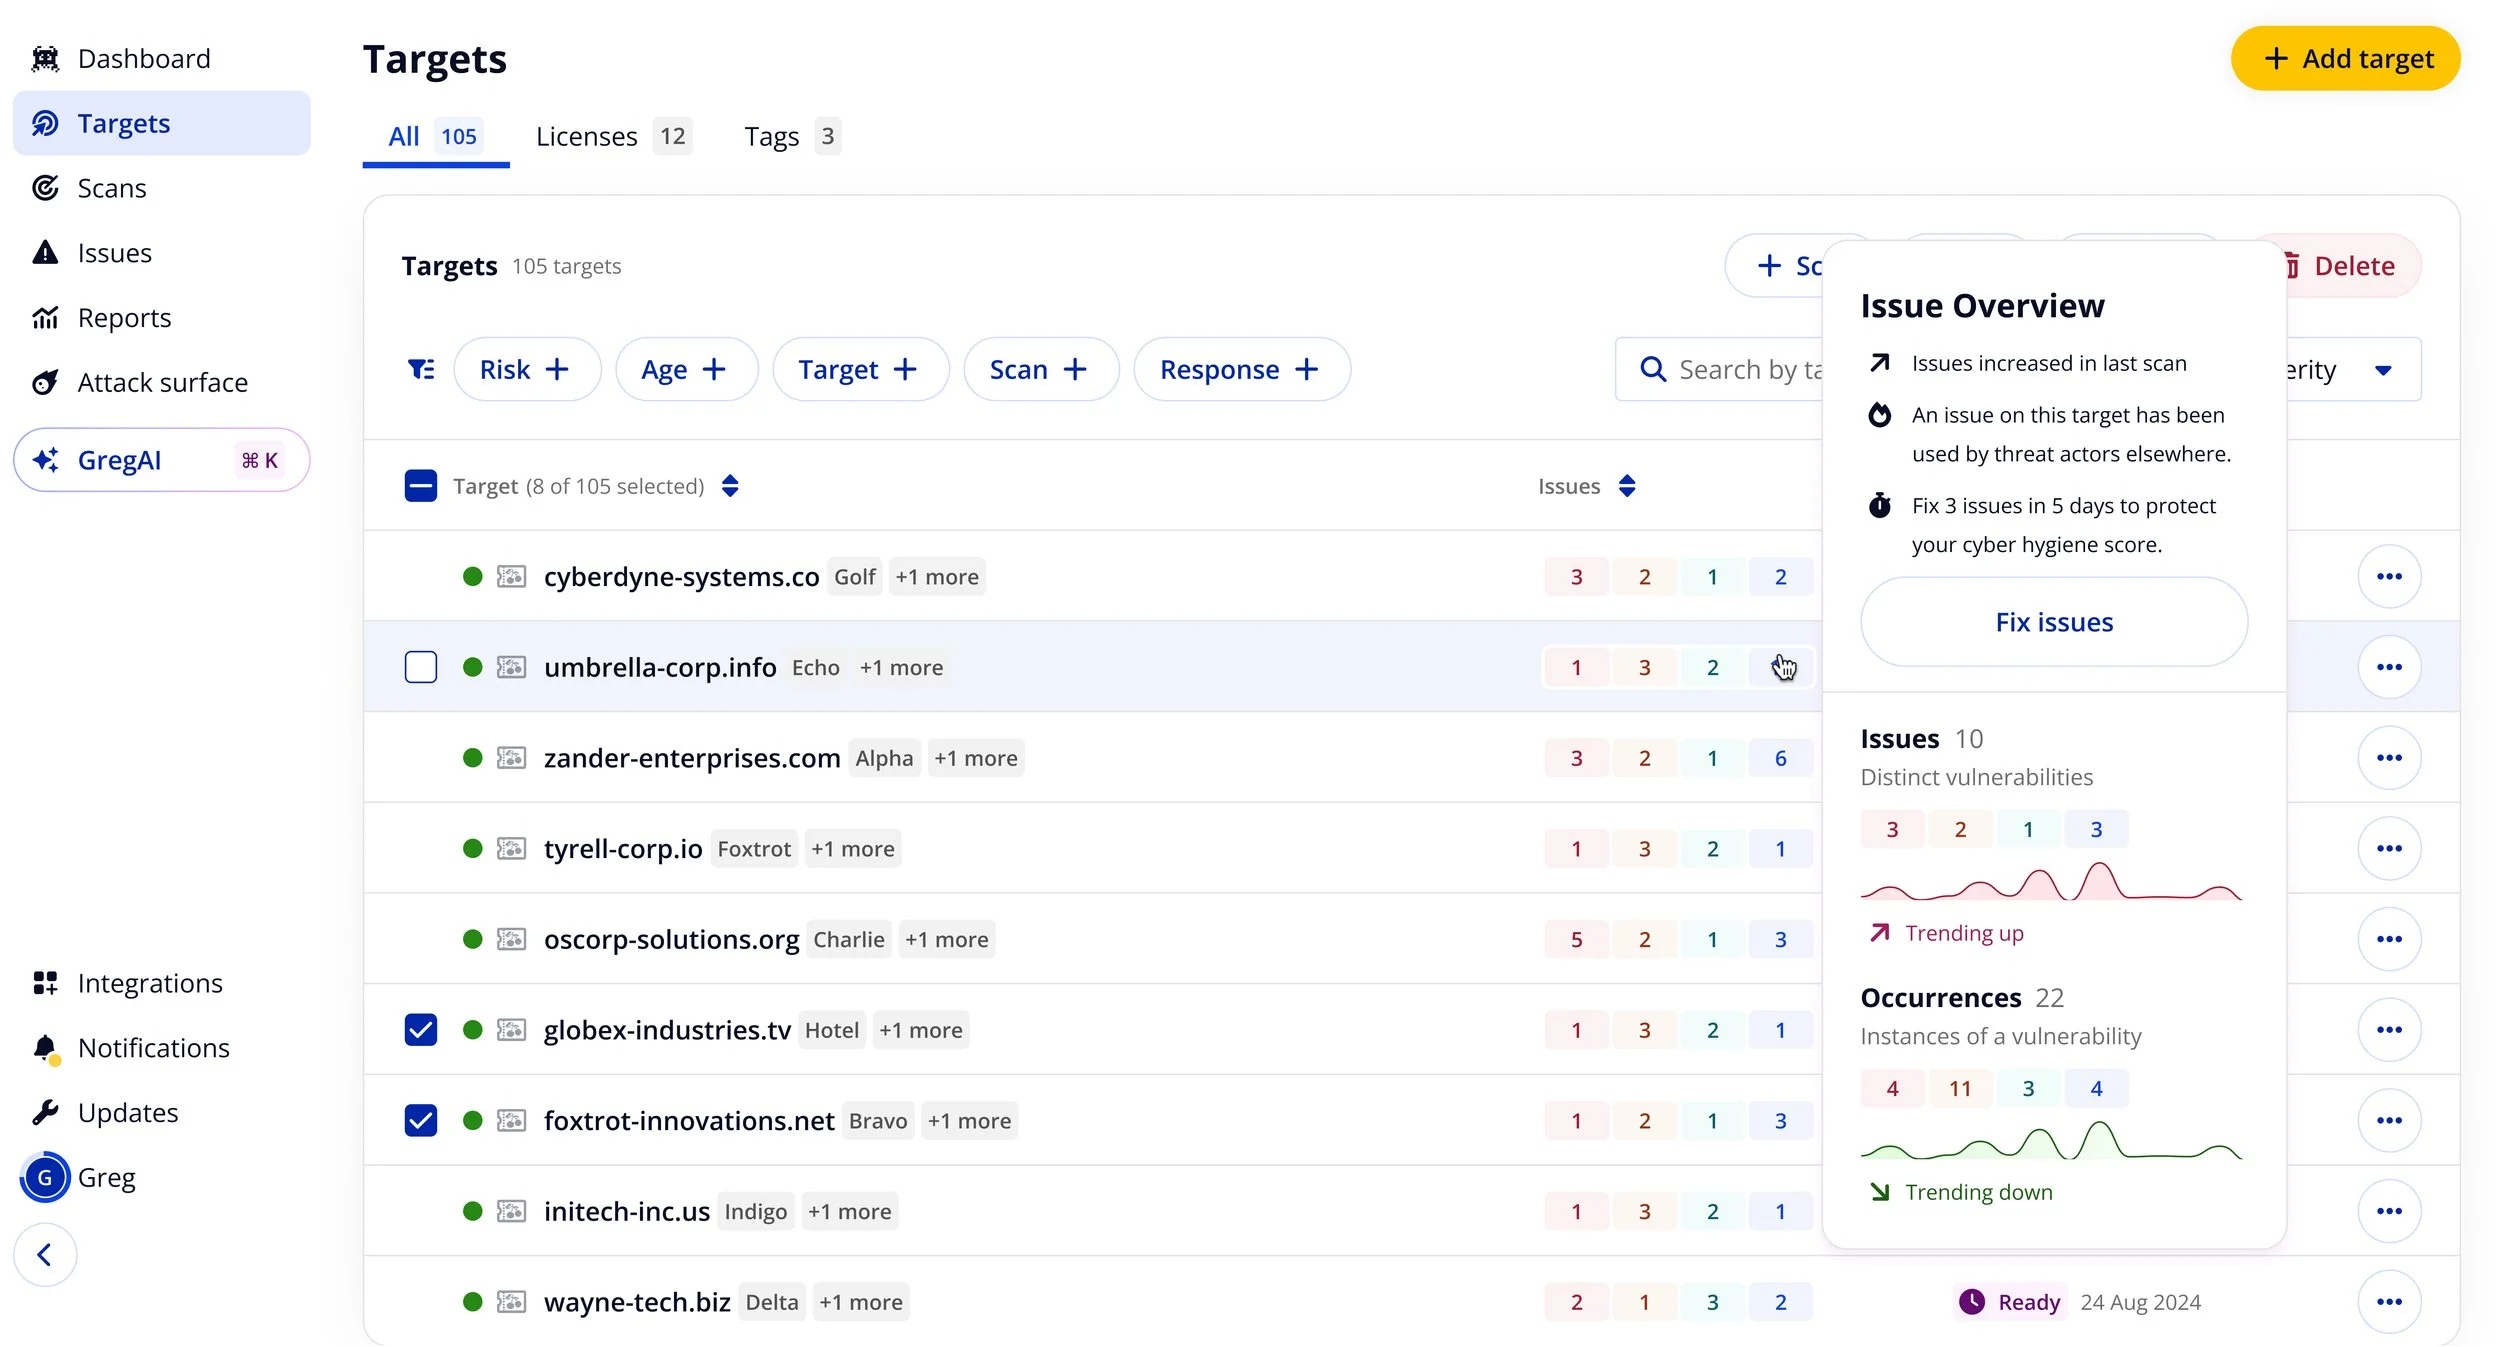
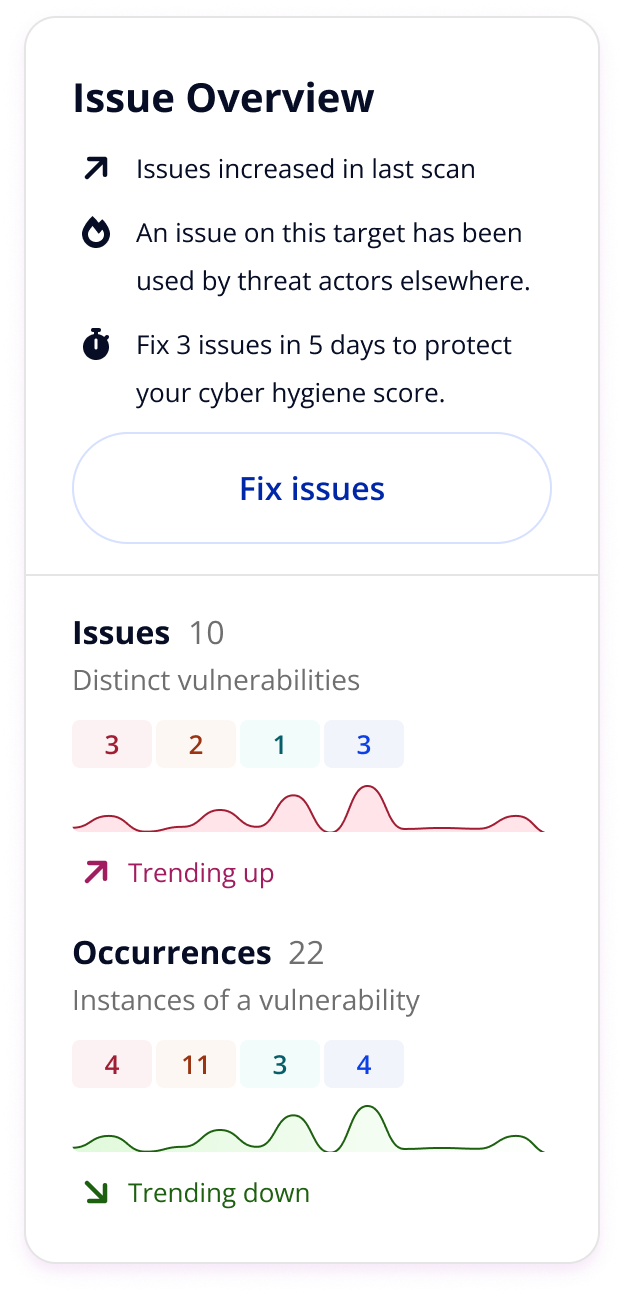
One of the first light-touch ways we did this was by giving customers more context at-a-glance in the form of popovers. These would help cut down the time taken for customers to determine which issues needed fixing soonest.
Comparative Cyber Hygiene Scoring
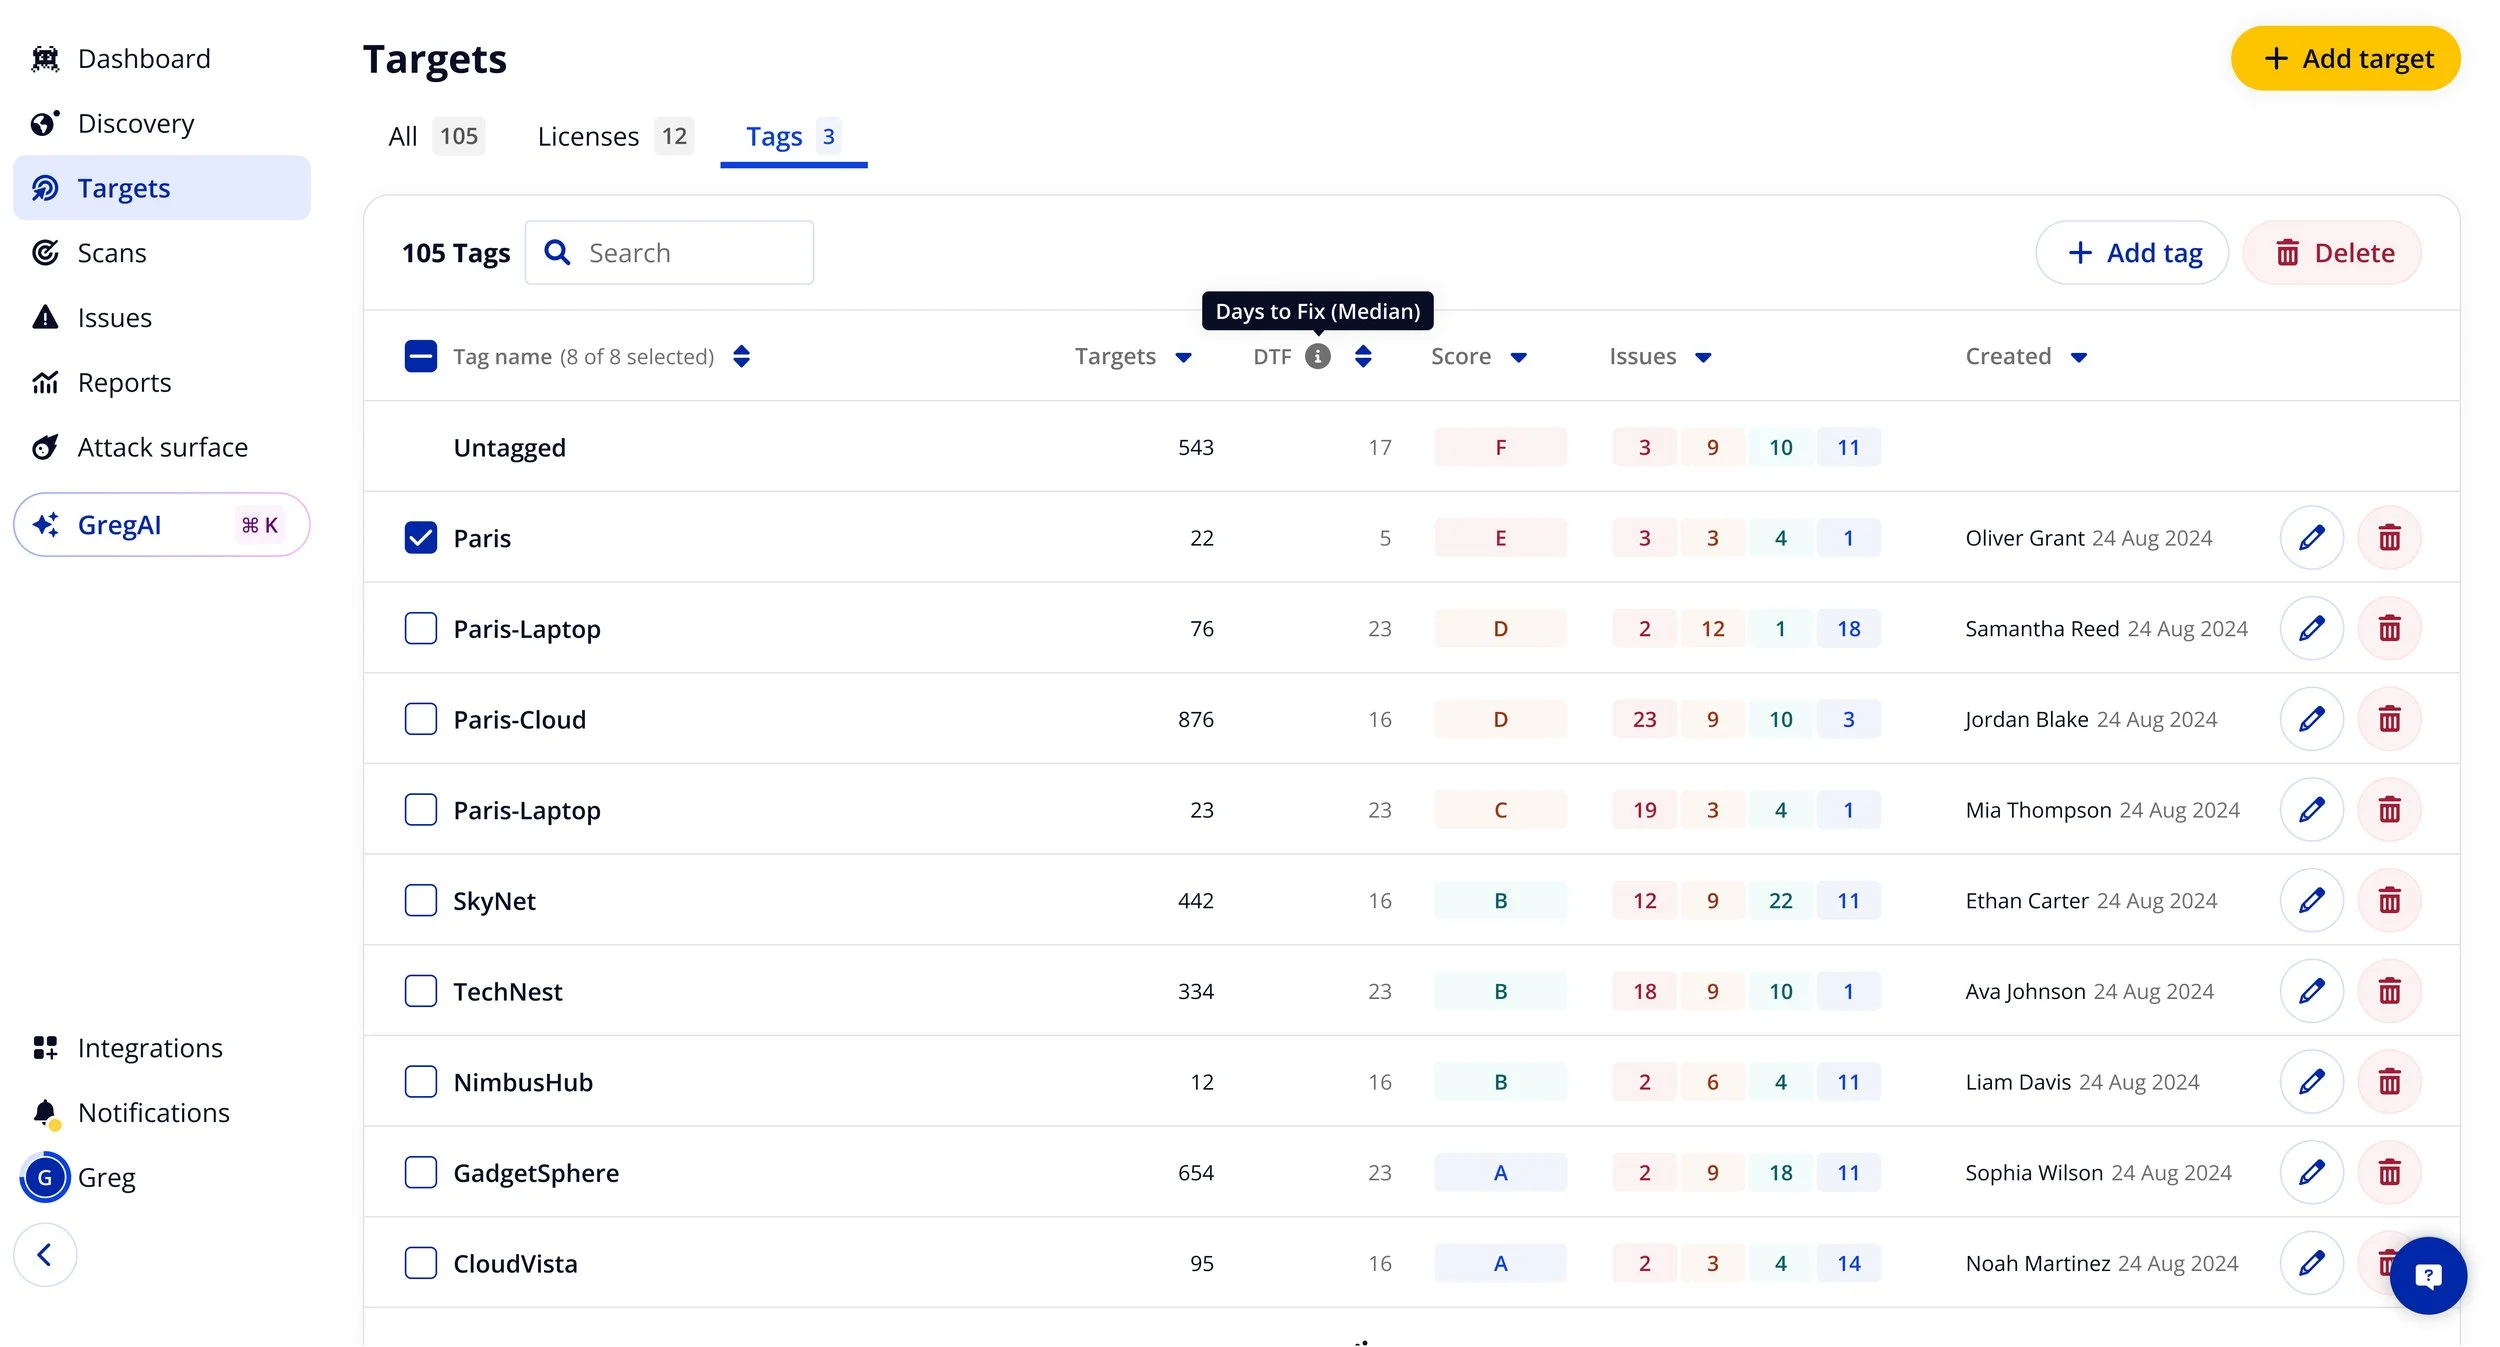
A more impactful change was making Intruder’s cyber hygiene score much more prominent, and much more granular than it had been before. Intruder’s cyber hygiene score was a tripwire system that gave the customer a grade depending on how many vulnerabilities were older than Intruder’s recommended guidelines, or outside their own stated SLAs, if provided.
I did this by taking our tags table, a relatively neglected feature largely considered to be of low value internally, and iterating on it. Adding vulnerability counts by severity, cyber hygiene score by tag, and the median days to fix a vulnerability for each tag.
This had never been provided to customers before, and solved a lot of problems raised by them. Problems that had previously been thought to have only been solvable by Intruder expending considerable toil on building a multi-tenancy feature-set.
Usage and reference to the cyber hygiene score saw a jump amongst our biggest clients when we put this out, this had a practical effect of reducing customers median days to fix.
During the period recorded the average days to fix for our enterprise customers reduced by 10x when this was exposed to them clearly. One of my personal highlights was joining Customer Success calls with some of our largest customers and hearing about how they were using it following it’s general release.
Adding exploit data to Cyber Hygiene scoring
Another change I looked at to help communicate the value of Intruder was to tie the exploit data into Intruder’s Cyber Hygiene scoring.
Historically Cyber Hygiene had only relied on a vulnerabilities Severity, but combining this with Likelihood was something our most advanced customers were doing already to produce their own scoring.
I worked closely with these power users to ensure the solution we ended up with would save them effort and eliminate the need for their own internal processes.
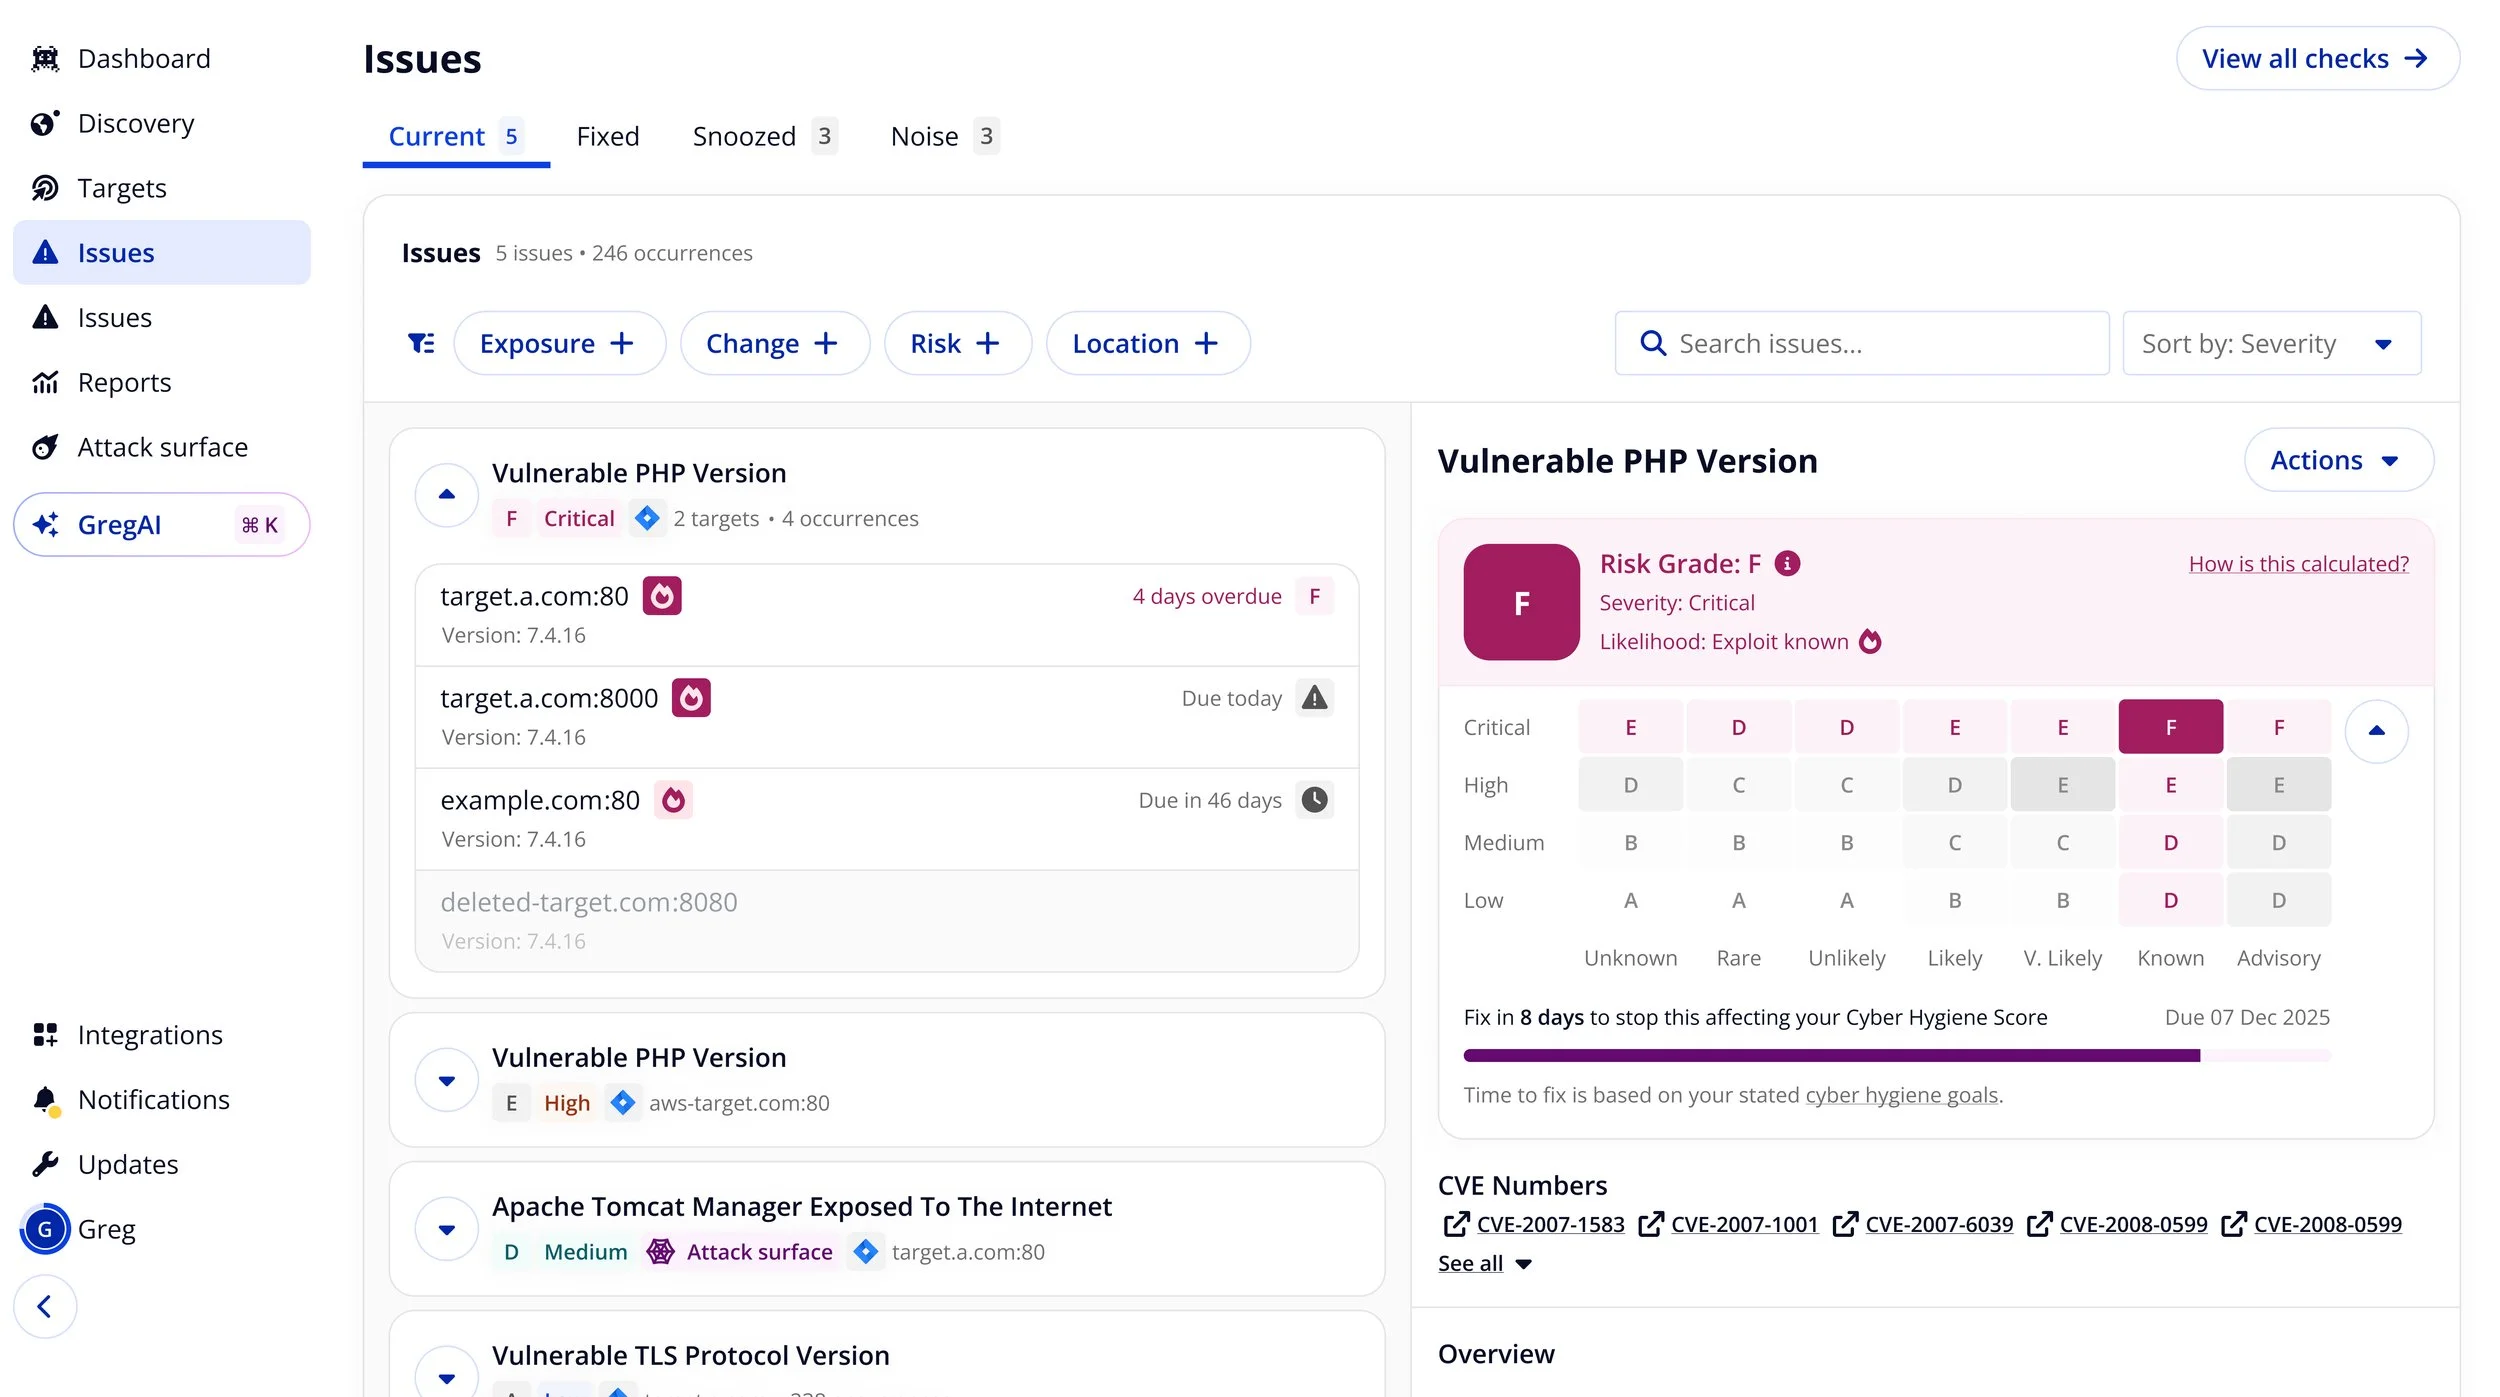

Part of this project was being able to effectively communicate that some lower severity vulnerabilities were actually much more significant because they were being actively exploited by bad actors in the wild. So we weren’t producing new checks, but better presenting the context and the significance of issues a customer might otherwise dismiss.
These changes helped nudge the customer into much clearer workflows focused around ensuring the tripwire of their cyber hygiene score didn’t go off. However, if it did the scoring was granular enough that it didn’t discredit the scoring overall and cause customers to disengage. It also helped them effectively untangle problematic areas of their estate from high performing areas.
Off the back of this I also got buy-in for a project to extend cyber hygiene scoring to consider the priority a user assigned to tags. This would allow me to design a three-dimensional threat ‘matrix’ which would give customers real control, both over how their estate should be assessed, how licenses should be allocated, and how to prioritise what vulnerabilities to fix first.
Unique targets scanned
We also looked into how to increase the number of targets being scanned. This was particularly important as Intruder’s revenue model was directly tied to selling licenses which enabled the scanning of targets. Recent integrations with cloud providers had led to a big increase in targets, but licensing hadn’t kept up with this.
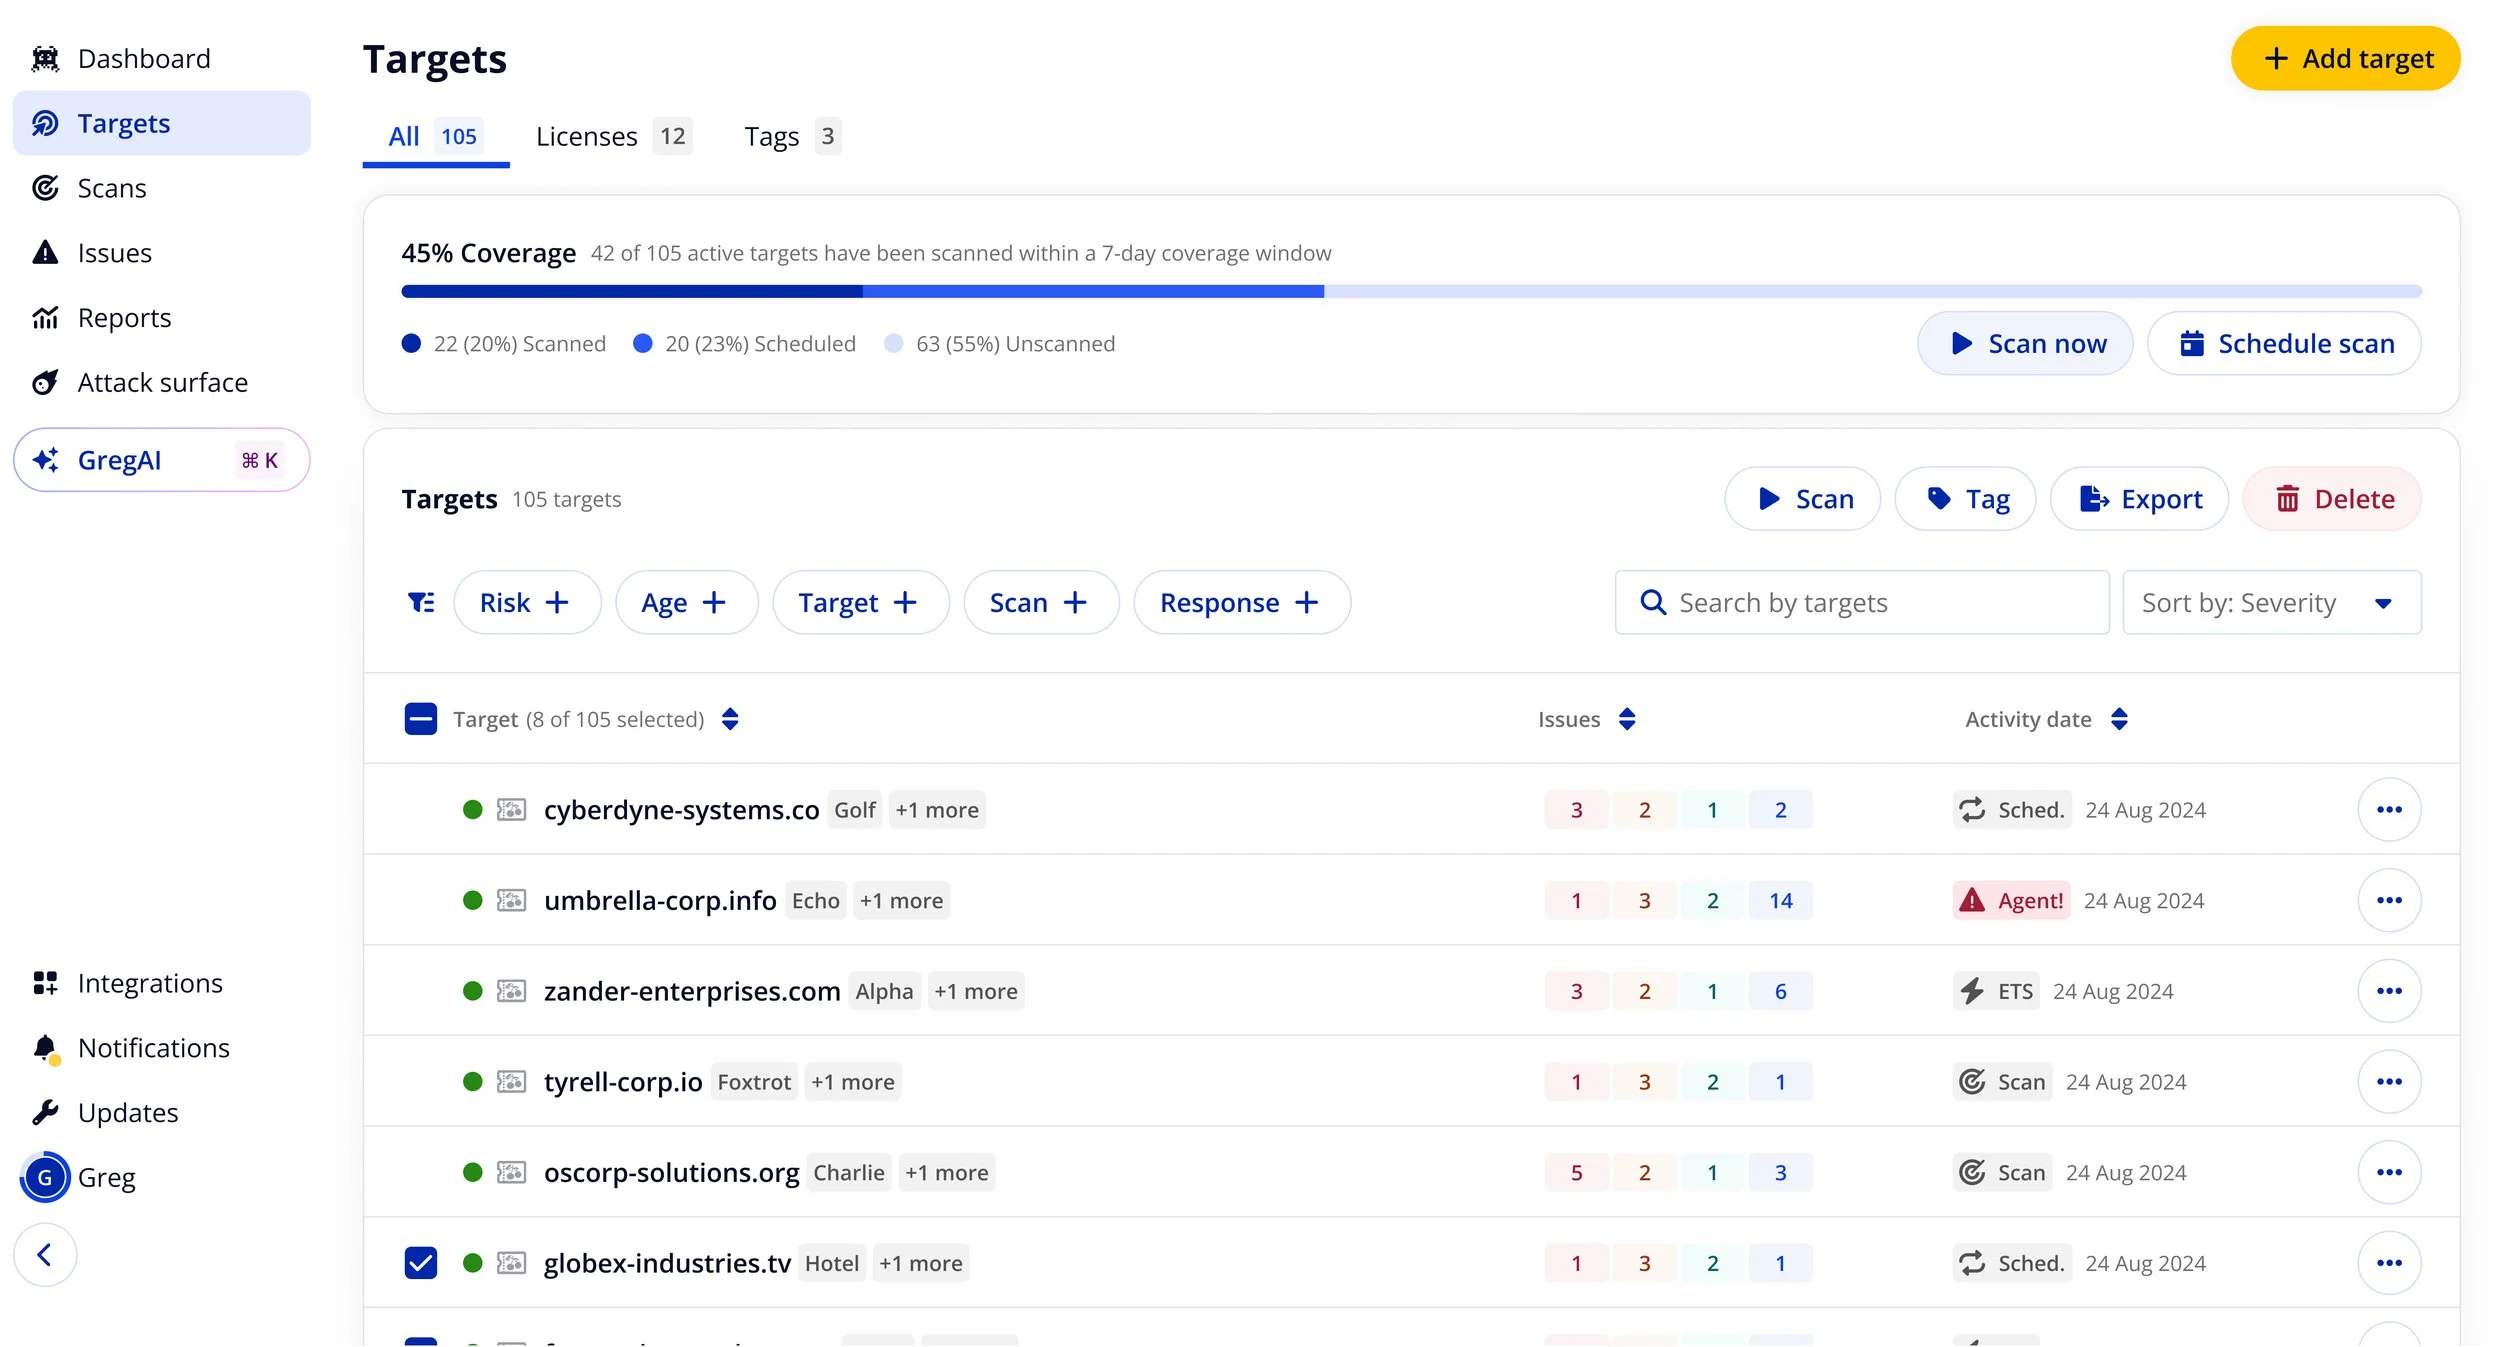
Introducing Target coverage
To normalise the idea of regularly scanning all your targets I settled on introducing the concept of ‘Coverage’ into the Portal. This would represent how many of the customers unique targets had been scanned in the last 7 days. 7 days was chosen because our Security team recommended a Critical vulnerability not being allowed to age beyond that.
I first exposed this concept to customers with a small widget at the top of targets table, this communicated how may targets had been scanned in the last 7 days. This encouraged customers to either scan now or set up a recurring scan to automate this process.
Scan scope upsell opportunities
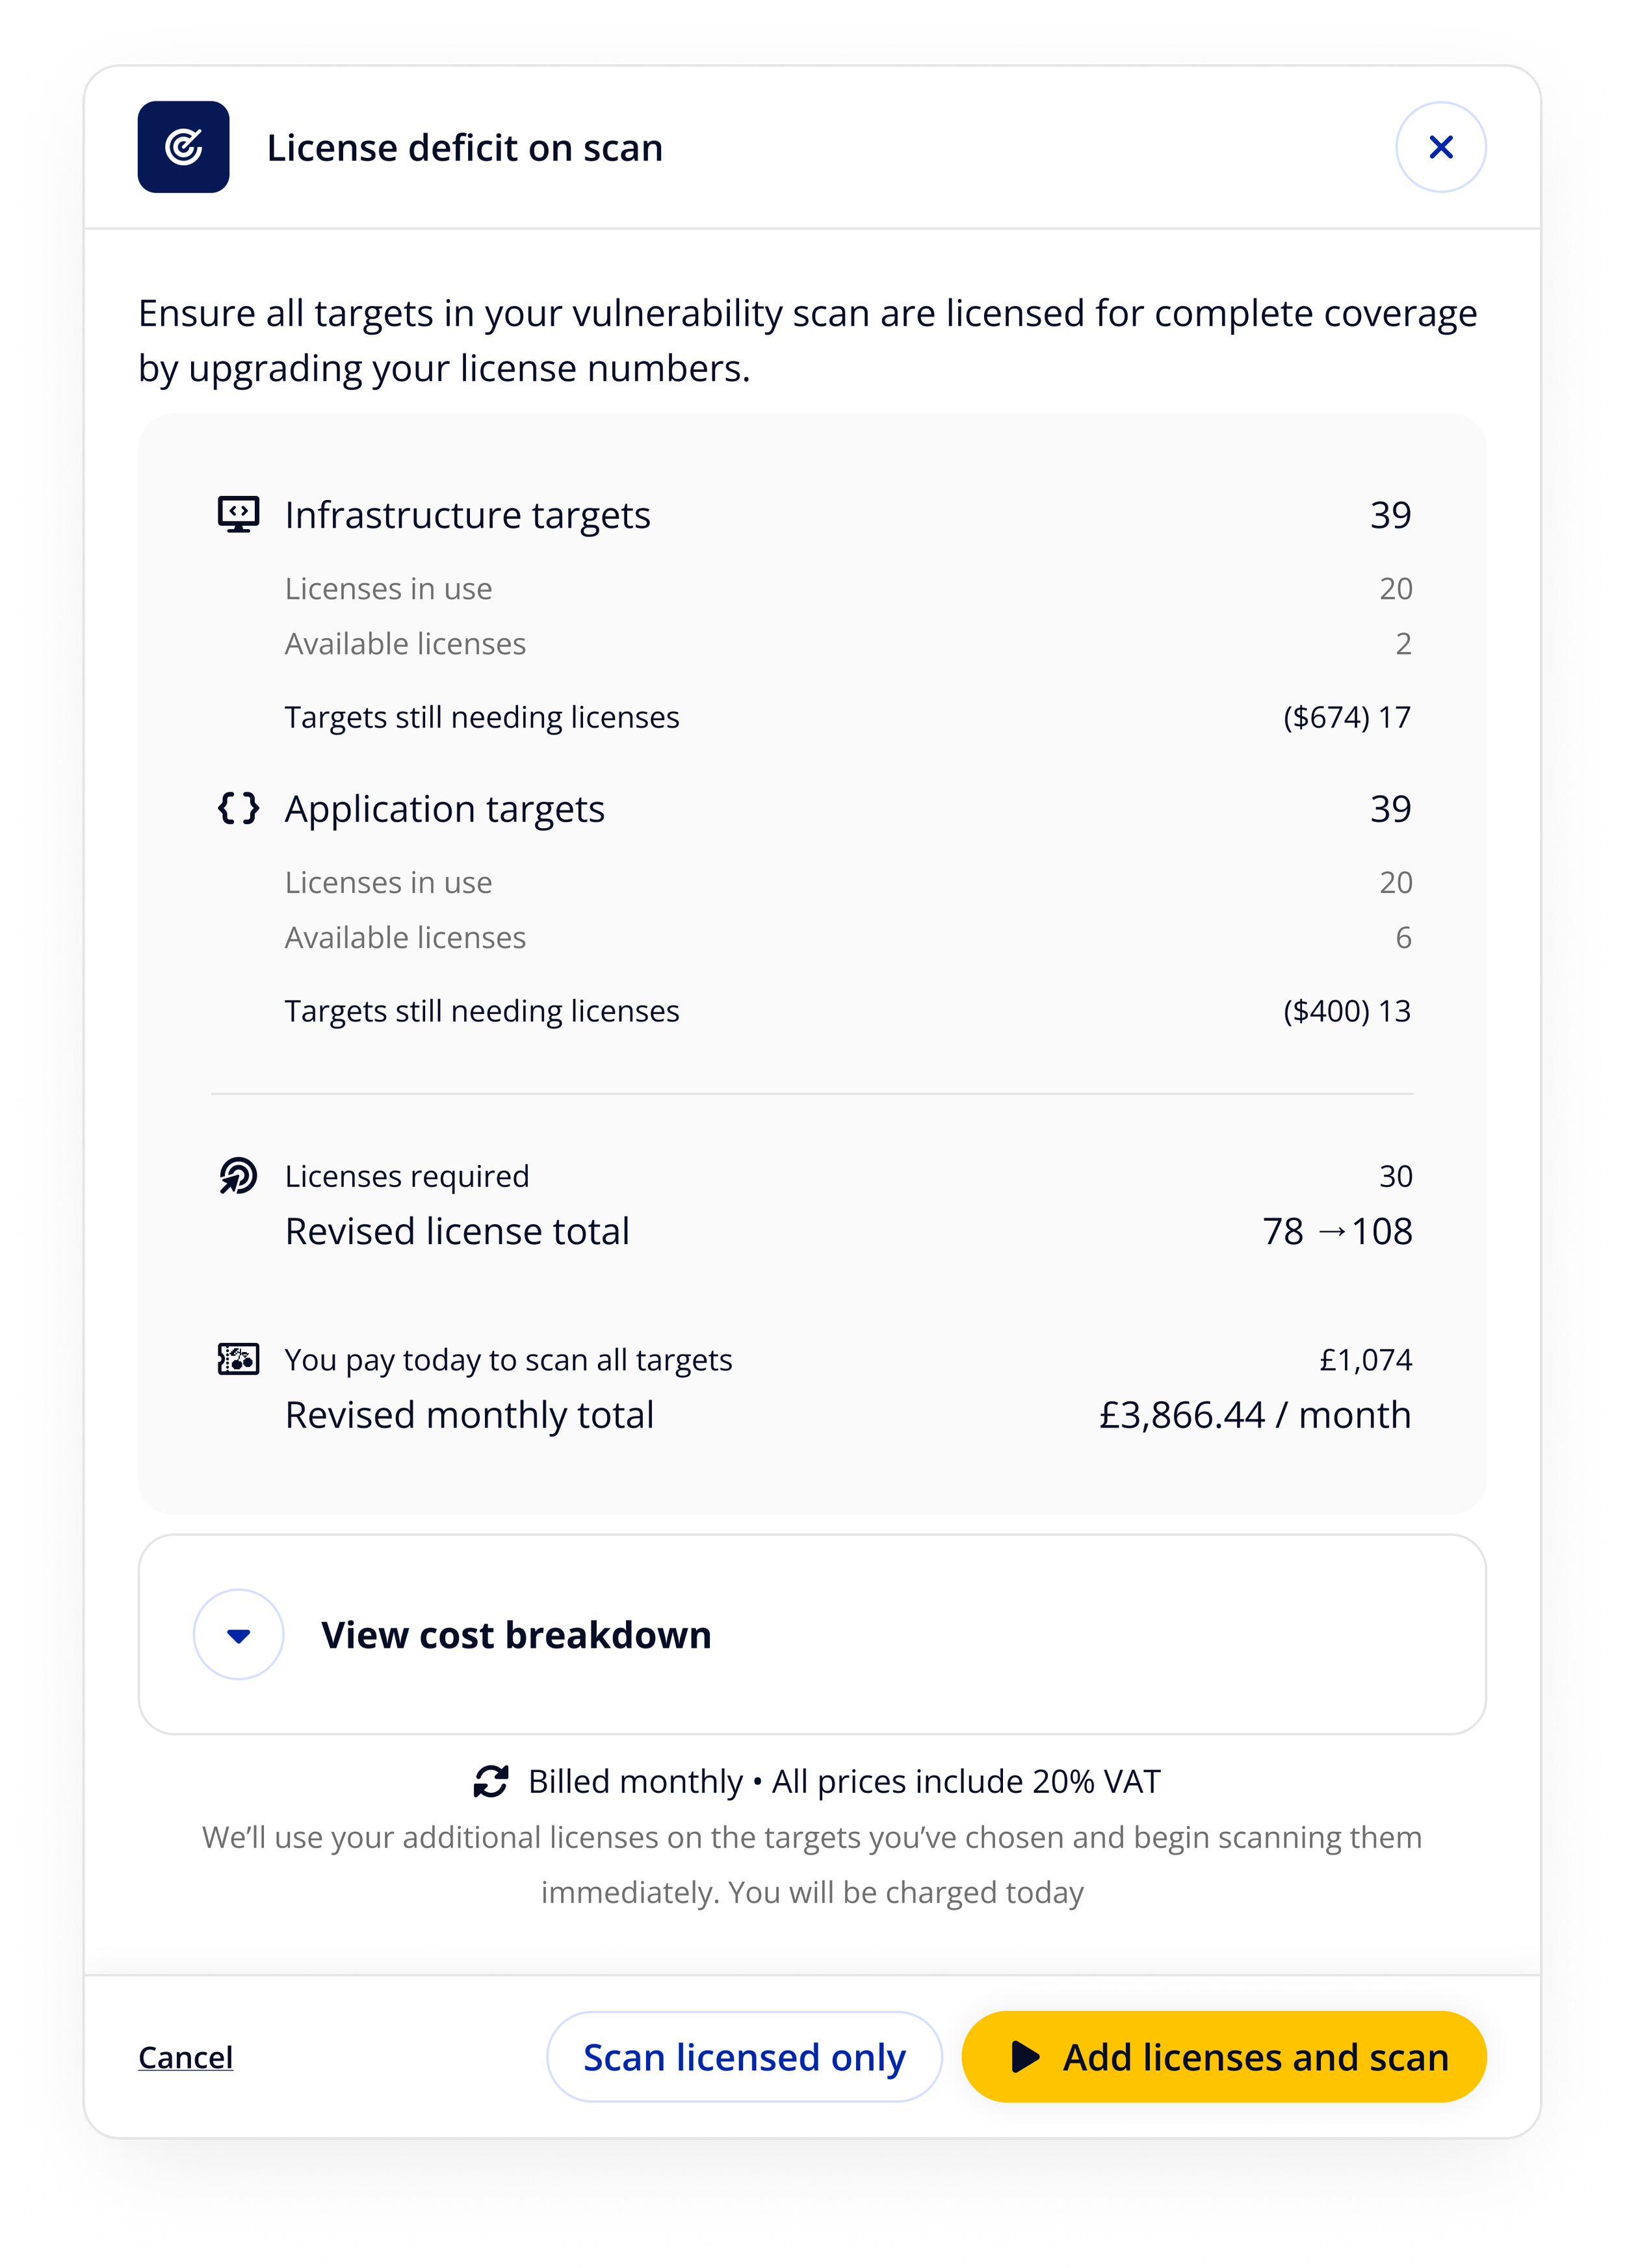
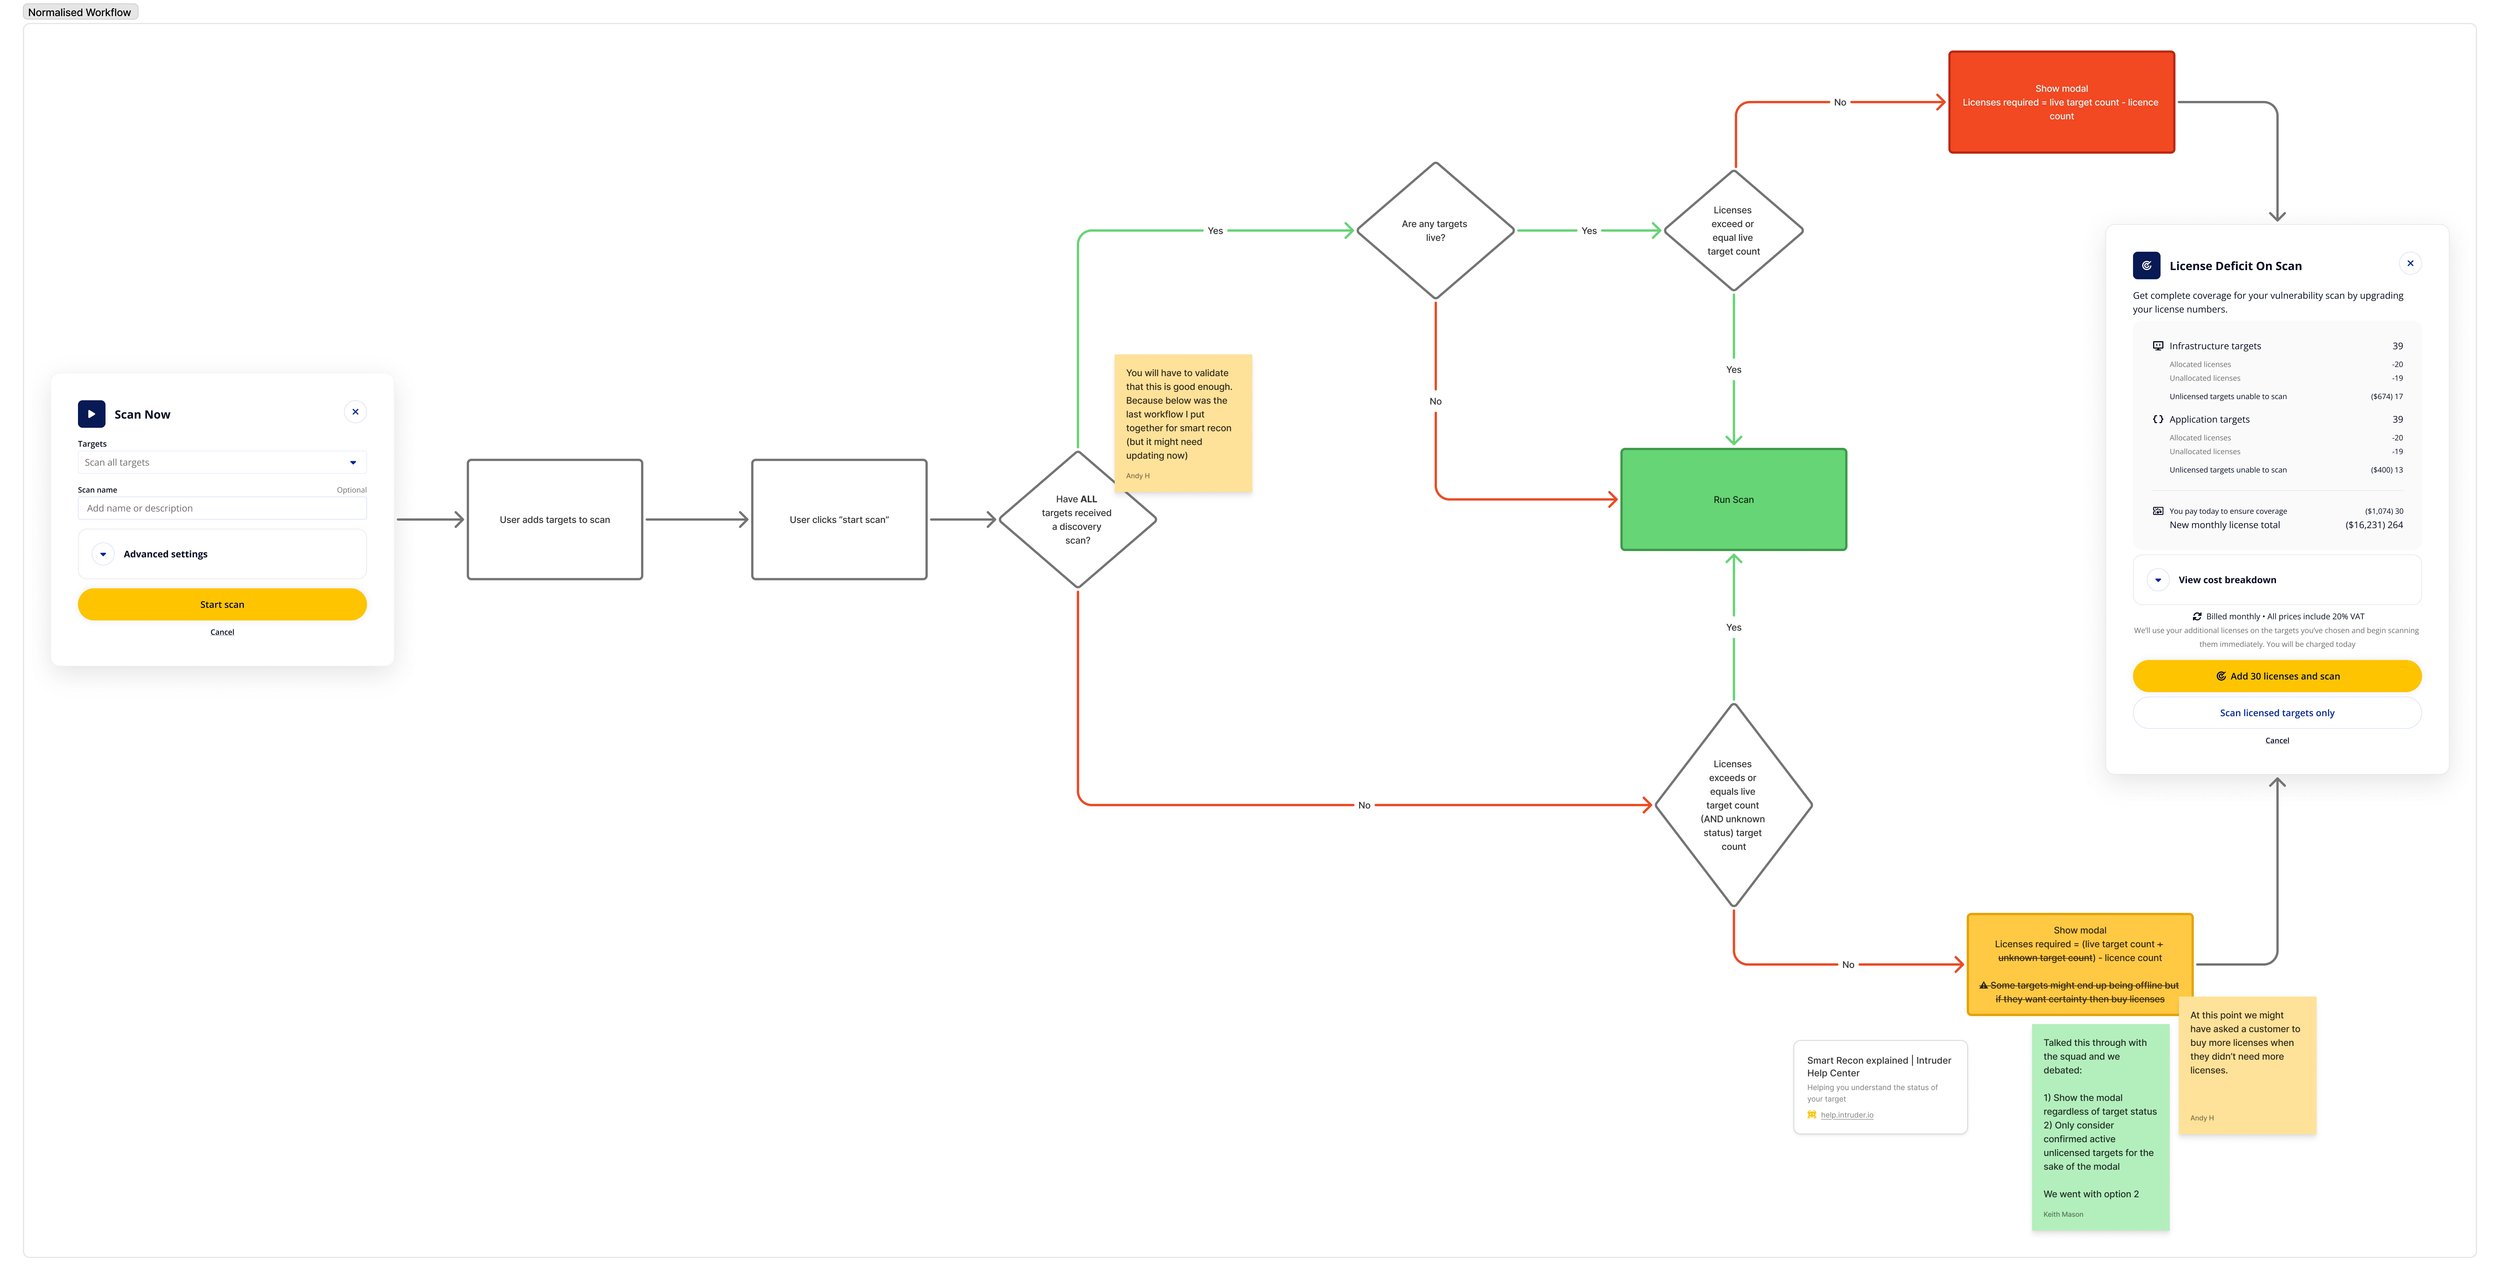
I then followed this up by introducing a modal after a user begins a scan with unlicensed targets in its scope. This enabled customers, before the scan kicked off, to purchase the licenses needed and ensure everything in scope could be scanned.
This hadn’t been done before because Intruder allocated licenses randomly to unlicensed targets when they were scanned, so a customer could purchase a license for one target only to have it go to another. This was compounded with the existence of automated scans. This had frustrated previous attempts by Intruder to introduce upsell mechanics.
However, I found a way round this by immediately triggering a scan on the targets in scope as soon as the licenses became available. This approach allowed us to prompt the user into expansion opportunities at critical moments.
Constraints and Trade-offs
Whilst the flow identified the core way customers experienced value at Intruder we realised this initial pass did not get into the true granular detail of all the ways customers experienced value at Intruder. This was because if we tried to capture every nuance the level of detail would stop peers and colleagues being able to grasp a high level overview of what it was we did. So the following were kept at a high level or omitted from the initial release of the metrics:
Reporting features: Many customers came to Intruder for some form of reporting need. This could be externally in the case of compliance, or internally to demonstrate the performance of teams and departments. Whilst important this was not an aspect of the business that was monetised at the time and did not conflict or diverge from the identified north star metric of fixing severe issues. As a result it was omitted from the initial release.
Help fixing issues: Intruder focused on the identification and monitoring of vulnerabilities, and only provided limited support with addressing them. Limited effort was expended here, as when customers couldn’t fix an issue we found it did impact their perception of Intruder, but we captured this solely by focusing on relative movement in the growth lever ‘Age of occurrences’ as a measure of how well we were doing in this space.
Additional services: Over time Intruder began to offer additional services not tied to the licensing model to existing customers as upsell opportunities. Intruder either did not want to grow these past a certain percentage of its revenue or were so putative that it was decided not to focus on these initially as they did not contribute towards the substantive growth of the organisation at that point in time.
Outcomes
The primary outcome of adopting this framework was that we began to prioritise opportunities based on behavioural data, becoming much more customer orientated. Internally people understood revenue was ultimately downstream of value, and everyone had a much clearer idea how they contributed to the growth of the organisation.
12 months after release we were able to measure the following growth across our north star and three main key drivers:
+140%
Driver 1: Non-noise occurrences published
+94%
Driver 2: Unique targets scanned
Whilst the metrics framework couldn’t claim responsibility for all of this growth it was a consistent measure anyone in the business could refer to. Outside of revenue that hadn’t existed before. It also made if very easy to see the bottlenecks in growth and the necessary focus areas of the business over time.
Squad Focus
Another big change was that I was able to advocate for following this was the adoption of dedicated product squads. When they were rolled out each squad had growth lever allocated to it by the VP of Product and the Senior Leadership Team on a quarterly basis to focus on and pull upon. This led to increased transparency, accountability, and much clearer measures of success for the squads in question.
External Recognition
The framework also gained recognition not only internally but also externally, where it was showcased by Count in their webinar Making OKRs Work and featured in their public gallery.
Count Webinar: Making OKRs Work, featured Intruder’s approach as a case study in effective metric-driven strategy.
Count Gallery: Intruder OKR Canvas & Product Metrics Map, high-fidelity dashboards created by Count, based on the framework I instigated at Intruder.
+31%
Driver 3: Trial-to-sign up
+363%
North Star: Severe Occurrences fixed
Reflections
Being able to refer to these product metrics on a regular basis, on demand, has been a genuine game-changer for myself and everyone involved in shipping changes to the Intruder product. One of the major challenges with it was taking it from something abstract to something we used to determine projects we were going to implement, and a major part of that wasn’t something I did but by bringing it to the people who could implement those changes at the strategic level and carry them through.
A big part of the time taken on this project was on getting buy-in from all the key stakeholders. Because implementation led to a shift in projects being determined by one set of criteria, to another and adjusting to that was an involved process for everyone. Ideally we would have gone even further than we did, to really prioritise learning exploring what drove growth and represented value to customers by pivoting to focus a lot more on rapid experimentation and iteration. This was something that we didn’t quite come round to and despite this was cognisant that where we ended up was a great improvement over where we were before this project began.
Practically this was also something done around my other day-to-day work, and given more time perhaps could have explored more of the following:
Experimentation Emphasis: A greater use of experimentation would have allowed us to validate and generate a lot more hypothesis, and produce a steady stream of recommendations using them. I’d done this previously in other roles and it’d have been great to do some more of it in this context.
Deeper Marketing Collaboration: Based on my prior experience I knew that Marketing was a great way to rapidly test and learn what spoke to prospective and current customers. Product learning cycles tended to be more labour intensive and slower. Formalising an ongoing relationship with Marketing in this regard is something I’d love to have instigated.
Culture of Learning: Long term it’d have been great to normalise learning about our customers as a high-profile topic internally. I’d seen this in prior roles and this was one angle the Head of Support and I explored in collaboration with the Head of People which I’d loved to have returned to given the opportunity.